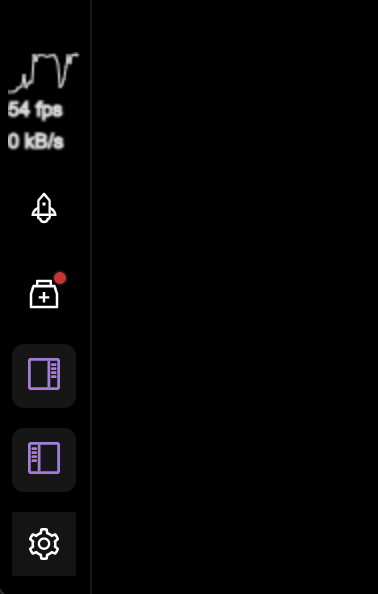
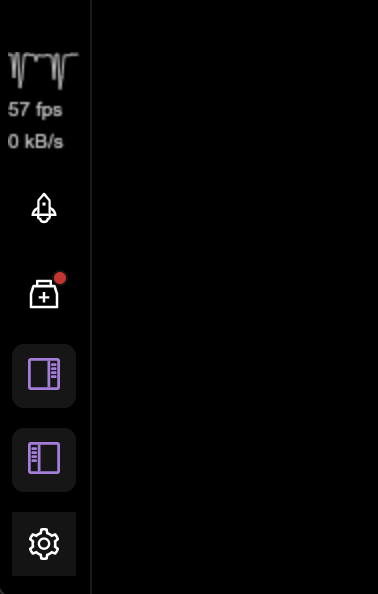
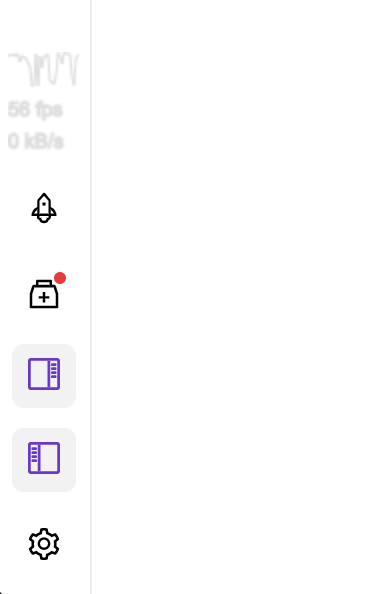
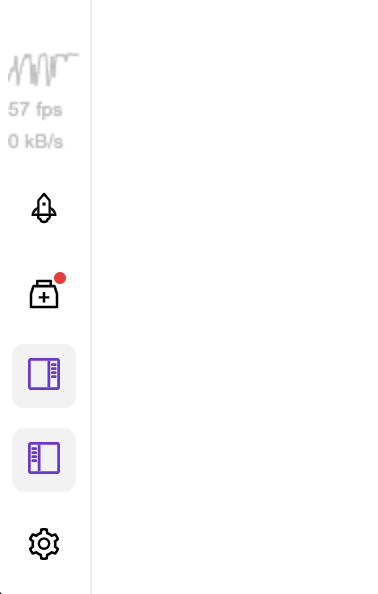
Summary:
This PR updates the performance Canvas widgets readability in Dev mode.

Currently, for unknown for me reason, the text was rendered with stroke not fill, which results in blurry text.

Also the color of texts and plot in light mode have not enough contrast in comparison to the background. I have tried to use `theme` in there, but unfortunately the CSS variables are not available in the Canvas context and using those values leads to always black text.

## Changelog

* improve the performance canvas widgets readability in Development mode

Pull Request resolved: https://github.com/facebook/flipper/pull/3333

Test Plan:
The change has been testes by running the desktop Flipper app locally from source.

## Preview (before & after)

#### Dark Mode
<img width="189" alt="Screenshot 2022-01-23 at 17 46 20" align="left" src="https://user-images.githubusercontent.com/719641/150689046-28895487-d488-440f-9440-f792daeca86f.png">
<img width="189" alt="Screenshot 2022-01-23 at 17 54 59" src="https://user-images.githubusercontent.com/719641/150689179-5ef96ca3-78e0-4995-b60c-317a87082604.png">

#### Light Mode
<img width="189" alt="Screenshot 2022-01-23 at 17 46 27" align="left" src="https://user-images.githubusercontent.com/719641/150689061-a3264961-390a-4182-bd81-ba84b6e4979f.png">
<img width="189" alt="Screenshot 2022-01-23 at 17 55 09" src="https://user-images.githubusercontent.com/719641/150689188-17efc7d9-7add-409e-af3b-befa5fbba0bc.png">

Reviewed By: aigoncharov

Differential Revision: D33738722

Pulled By: lblasa

fbshipit-source-id: b992ecacd31bb6aa2a53885ca6dcc858fa510775
91 lines
2.3 KiB
TypeScript
91 lines
2.3 KiB
TypeScript
/**
|
|
* Copyright (c) Meta Platforms, Inc. and affiliates.
|
|
*
|
|
* This source code is licensed under the MIT license found in the
|
|
* LICENSE file in the root directory of this source tree.
|
|
*
|
|
* @format
|
|
*/
|
|
|
|
import React, {useEffect, useRef} from 'react';
|
|
import {fpsEmitter} from '../dispatcher/tracking';
|
|
|
|
const width = 36;
|
|
const height = 36;
|
|
const graphHeight = 20;
|
|
|
|
export default function FpsGraph({sampleRate = 200}: {sampleRate?: number}) {
|
|
const canvasRef = useRef<HTMLCanvasElement>(null);
|
|
|
|
useEffect(() => {
|
|
const fps: number[] = new Array<number>(width).fill(0, 0, width);
|
|
let lastFps = 0;
|
|
let lastDraw = Date.now();
|
|
|
|
const handler = (xfps: number) => {
|
|
// at any interval, take the lowest to better show slow downs
|
|
lastFps = Math.min(lastFps, xfps);
|
|
};
|
|
|
|
const interval = setInterval(() => {
|
|
const ctx = canvasRef.current!.getContext('2d')!;
|
|
ctx.clearRect(0, 0, width, height);
|
|
ctx.fillStyle = '#bbb';
|
|
|
|
const now = Date.now();
|
|
let missedFrames = 0;
|
|
// check if we missed some measurements, in that case the CPU was fully choked!
|
|
for (let i = 0; i < Math.floor((now - lastDraw) / sampleRate) - 1; i++) {
|
|
fps.push(0);
|
|
fps.shift();
|
|
missedFrames++;
|
|
}
|
|
lastDraw = now;
|
|
|
|
// latest measurement
|
|
fps.push(lastFps);
|
|
fps.shift();
|
|
|
|
ctx.font = 'lighter 10px arial';
|
|
ctx.fillText(
|
|
(missedFrames
|
|
? // if we were chocked, show FPS based on frames missed
|
|
Math.floor((1000 / sampleRate) * missedFrames)
|
|
: lastFps) + ' fps',
|
|
0,
|
|
height - 4,
|
|
);
|
|
|
|
ctx.moveTo(0, height);
|
|
ctx.beginPath();
|
|
ctx.lineWidth = 1;
|
|
fps.forEach((num, idx) => {
|
|
ctx.lineTo(idx, graphHeight - (Math.min(60, num) / 60) * graphHeight);
|
|
});
|
|
|
|
ctx.strokeStyle = missedFrames ? '#ff0000' : '#bbb';
|
|
|
|
ctx.stroke();
|
|
lastFps = 60;
|
|
}, sampleRate);
|
|
|
|
fpsEmitter.on('fps', handler);
|
|
|
|
return () => {
|
|
clearInterval(interval);
|
|
fpsEmitter.off('fps', handler);
|
|
};
|
|
}, []);
|
|
|
|
return (
|
|
<div style={{width, height}}>
|
|
<canvas
|
|
ref={canvasRef}
|
|
width={width}
|
|
height={height}
|
|
title="Current framerate in FPS"
|
|
/>
|
|
</div>
|
|
);
|
|
}
|